Bitcoin's Bull Market in Jeopardy as Price Slips Below 200-Day Moving Average
By: Isha Das
Market Analysis
Bitcoin, the most prominent cryptocurrency, is facing scrutiny as its price dips below the critical 200-day moving average (DMA). This technical indicator is significant in evaluating the health of a market trend, distinguishing between bullish and bearish periods.
DEFINITION:The 200-Day Simple Moving Average (SMA) is a vital technical indicator in financial analysis, often marking a transition between bullish and bearish market conditions.
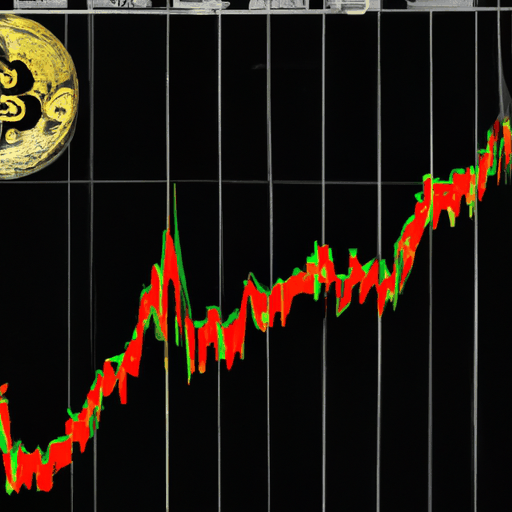
As of July 4, Bitcoin has fallen below the 200 DMA, positioned at $58,373. The last instance of such a decline was in August 2023. The 200 DMA serves as a psychological barrier and a trendline for traders, hence crossing below this benchmark is often perceived as a shift towards a bearish market trend.

(Source: Glassnode)
Since early 2024, Bitcoin's price has displayed robust growth, peaking above $70,000 in March. However, the subsequent correction and consistent testing of the 200 DMA indicate market vulnerability. The price action below this line traditionally implies potential market corrections.

(Source: Glassnode)
Historically, Bitcoin's price movements around the 200 DMA have been harbingers of significant market shifts. Reviewing the period from 2014 to 2024, several instances where the price surged above the 200 DMA were followed by substantial upward rallies, whereas descents below this marker have typically forecasted bearish trends.
The current scenario suggests a period of caution for investors and traders. As the market dynamics recalibrate post-halving, the breach of the 200 DMA might denote the conclusion of the latest bullish cycle, steering Bitcoin into a phase of price consolidation or further decline. This shift calls for careful observation of market trends and strategic positioning.
The importance of the 200-day SMA in diagnosing market conditions cannot be overstated. Markets that consistently trade under the 200-day SMA are generally in a downtrend, a notion that aligns with current Bitcoin market performance.
As the market adjusts, stakeholders are encouraged to stay informed and adaptive to the evolving conditions.


