Bitcoin's Market Dominance and Stability Amid Inflation: A 2024 Overview
By: Eliza Bennet
Bitcoin's Market Dominance Rises Amidst Volatile Crypto Landscape
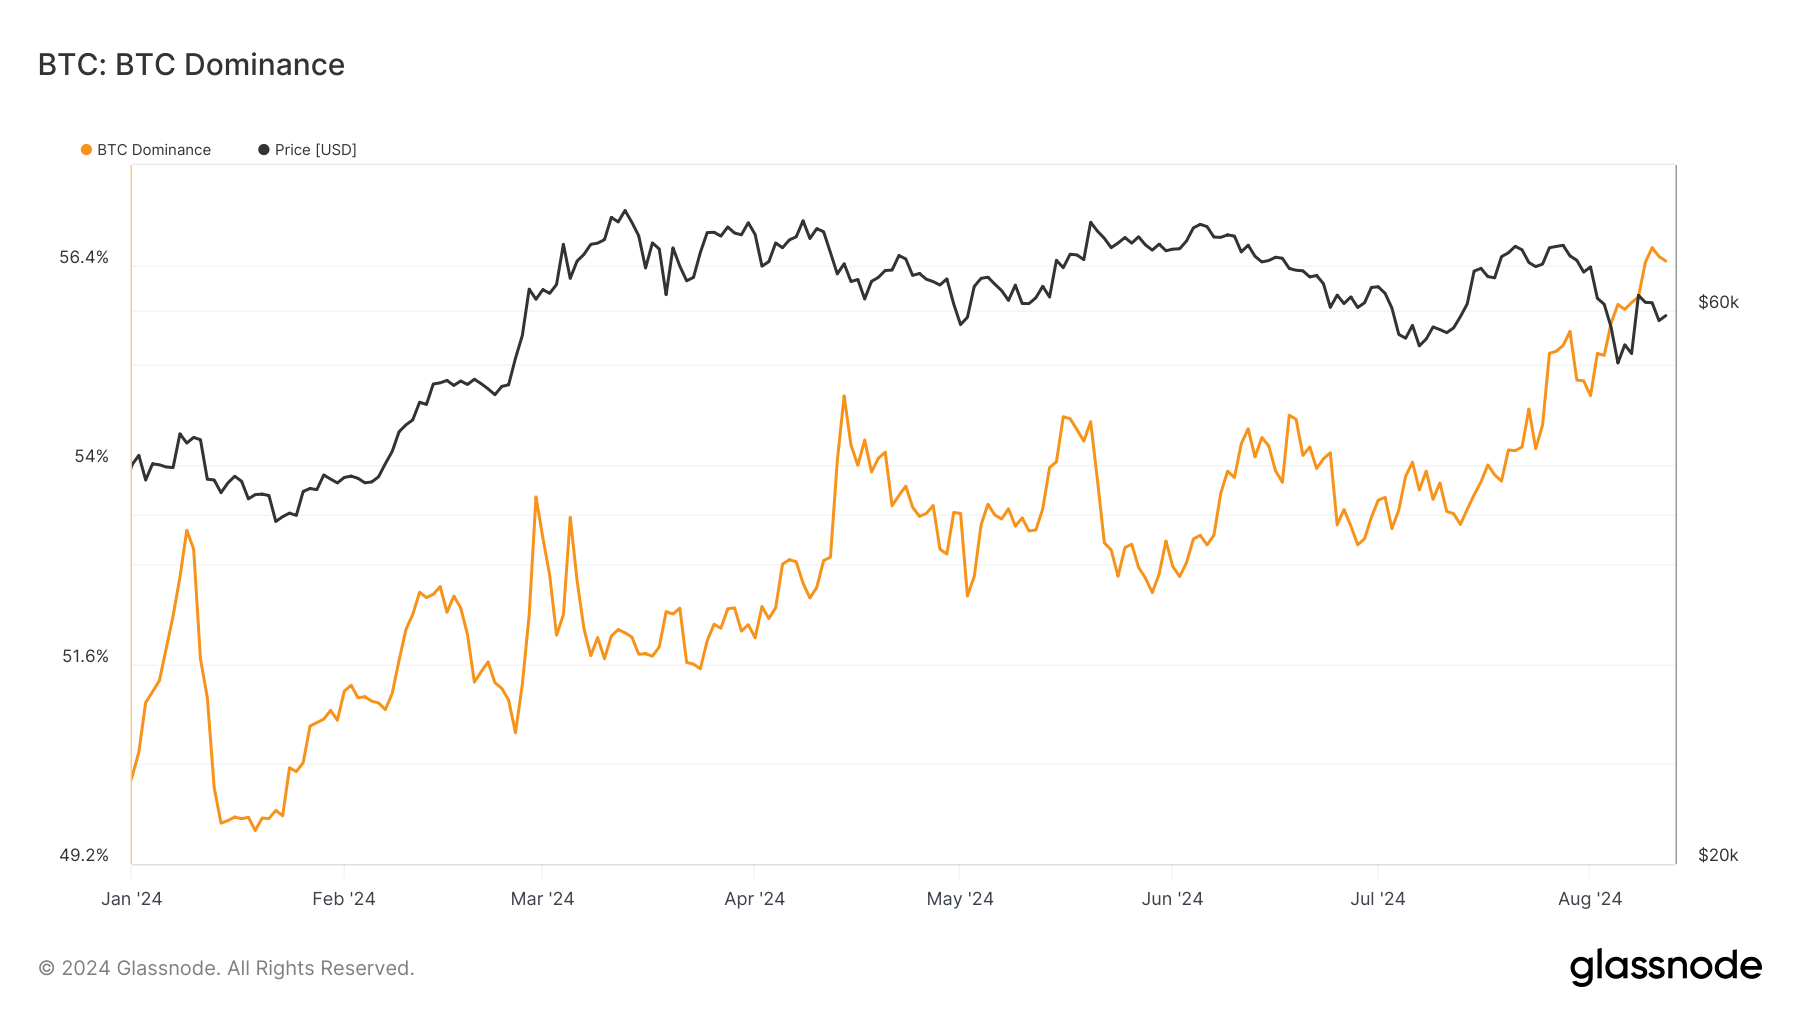
In 2024, Bitcoin's market dominance has shown a stable upward trend despite the overall market volatility. BTC dominance, which is Bitcoin's market capitalization as a percentage of the total market cap of all cryptocurrencies, has fluctuated between 49% and 57% throughout the year, reaching new peaks.
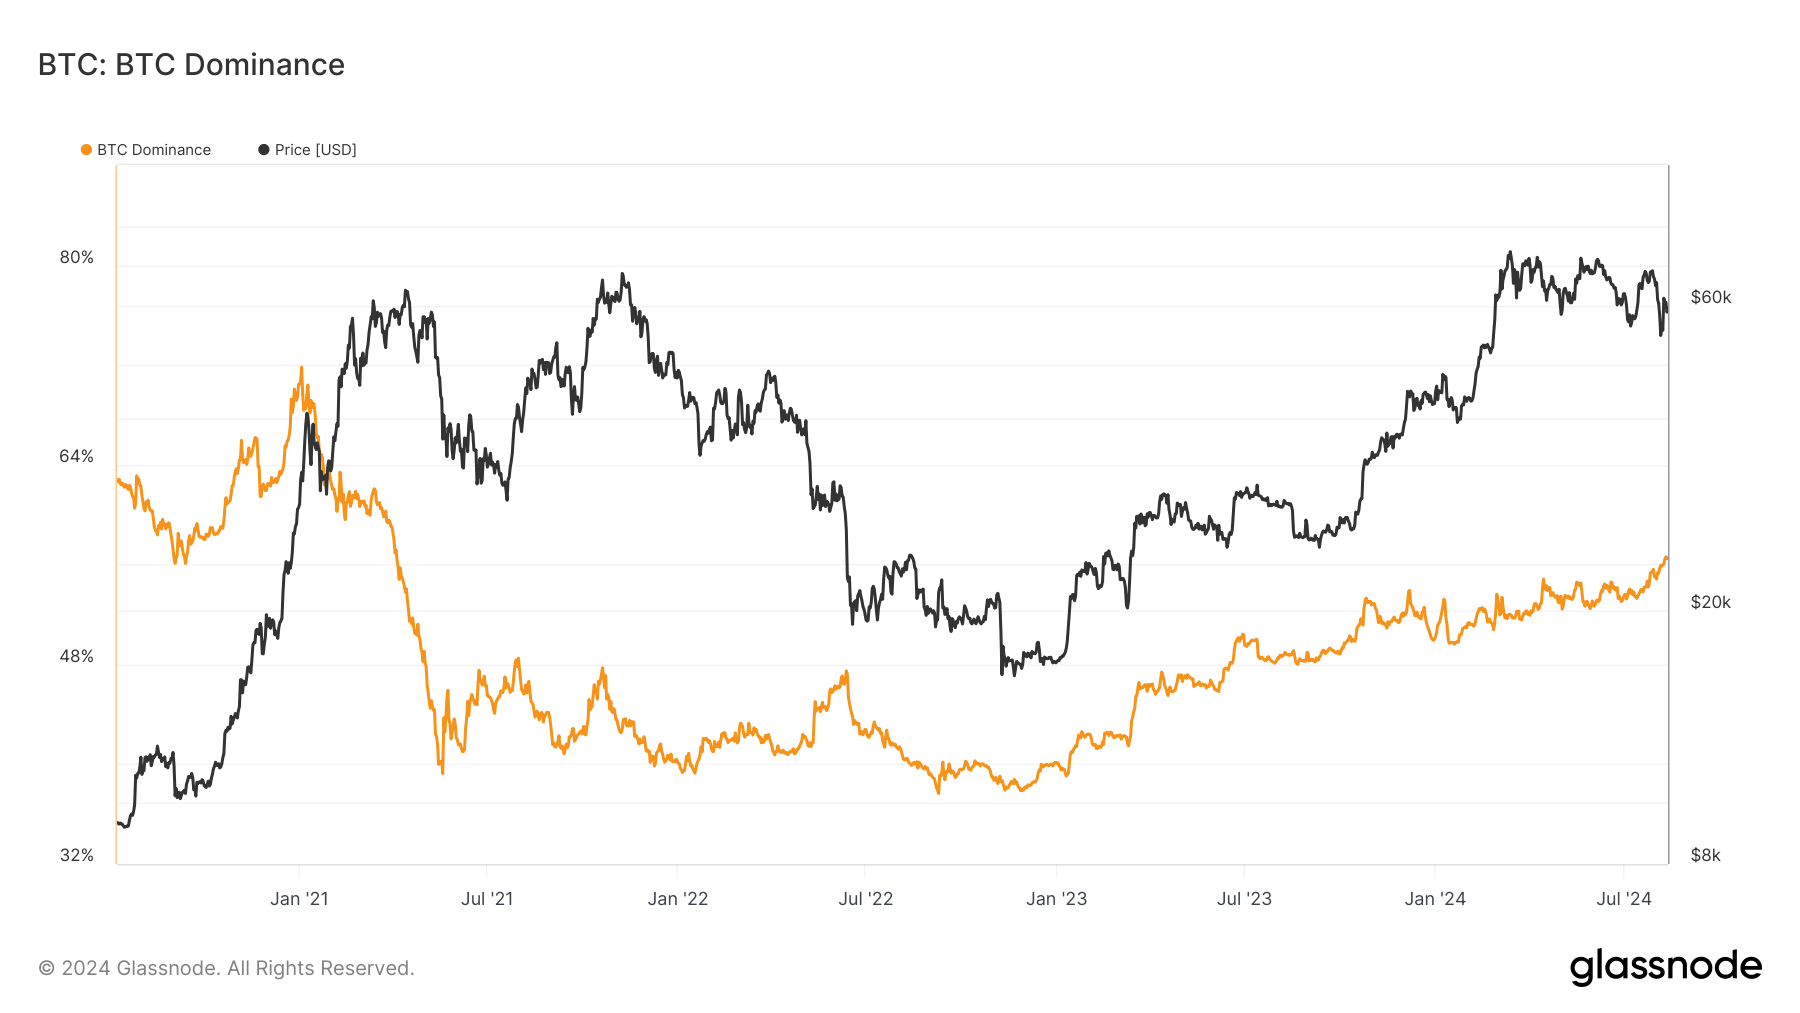
This trend underscores Bitcoin's continued relevance and growing influence within the crypto market, reversing the decline seen during 2021 and 2022 when its dominance fell from over 70% to below 40%. The reversal in trend since early 2023 indicates a strengthening position for Bitcoin, potentially bolstered by increased institutional interest and the maturation of its ecosystem.
For further details on cryptocurrency trends and metrics like BTC dominance, refer to sources such as Glassnode.


As we move forward, Bitcoin's dominance will likely continue to serve as a critical indicator for potential trends within the broader crypto market, especially as it maintains its position as a leading digital asset.
Impact of U.S. Inflation on Bitcoin Prices
In the financial landscape, the U.S. inflation rate hit 2.9% in July 2024, according to Trading Economics data. This figure came in slightly below market expectations. Following the release of this data, Bitcoin's price remained relatively stable around $61,000, indicating that market participants had largely anticipated the inflation figures.
The month-over-month inflation rate was in line with forecasts at 0.2%, as was core inflation, which excludes volatile food and energy prices. It registered 3.2% year-over-year and 0.2% month-over-month.

Bitcoin's relative price stability around the $61,000 mark amid these economic indicators might suggest confidence in its value and resilience, despite broader economic fluctuations.
Bitcoin's Struggle and Resilience Over $60,000
Bitcoin's price has recently crossed the critical $60,000 threshold, only to face challenges in maintaining momentum above the $61,500 resistance level. Despite showing resilience above the $60,000 mark and the 100 hourly Simple Moving Average, Bitcoin has encountered resistance near $61,200 and $61,500. A sustained move above these levels could potentially drive the price higher, with next major resistance around $62,500 and $63,500.
Technical indicators such as the MACD and RSI on the hourly chart have highlighted Bitcoin's ongoing struggle to maintain pace, with potential declines if it fails to clear these resistance zones. Immediate support levels are identified at $60,000, followed by $59,650.
For continued updates on Bitcoin price movements and significant resistance levels, refer to trading platforms like Kraken.


