Learn Concept: Understanding Bollinger Bands in Crypto Trading
By: Isha Das
Bollinger Bands are a technical analysis tool widely used in the trading of cryptocurrencies for assessing the volatility and potential price movements of assets, such as Bitcoin. Recently, Bitcoin's market has shown mixed signals with the tightening of its Bollinger Bands.
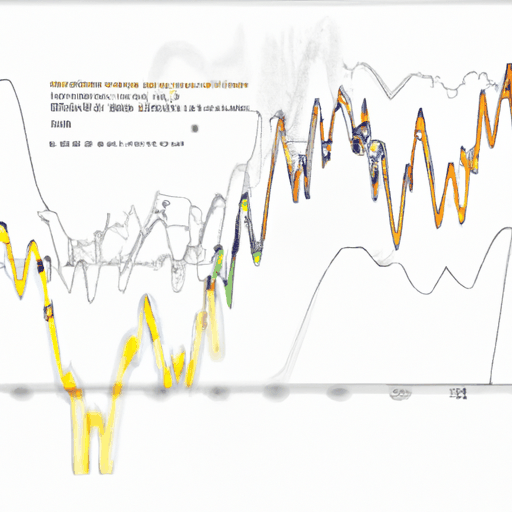
The tool, developed by John Bollinger in the 1980s, consists of three lines: a middle band, which is a simple moving average; and an upper and a lower band, which are standard deviations of that moving average. These bands expand and contract based on market volatility. When the bands are tight, it typically indicates low volatility and prepares for a potential price movement; conversely, wide bands signify high volatility, suggesting that a fluctuating trend could stabilize.
Traders often use Bollinger Bands to identify reversal patterns in the crypto market. When the price of an asset moves towards the upper band, it may be perceived as overbought, while a move towards the lower band may suggest an oversold condition. However, these scenarios are not always indicative of immediate reversal but can signal that a previous trend's momentum is waning.
In the context of Bitcoin, the recent tightening of Bollinger Bands implies a phase of consolidation that might precede a high-impact price change, alerting traders to prepare for significant market movements. Understanding how to interpret Bollinger Bands can be critical for traders and investors aiming to make informed decisions in a volatile market environment.
For further reading on Bitcoin's market volatility and strategies using Bollinger Bands, explore this article.


