The Significant Implications of the 200-Day Moving Average in Bitcoin's Market Trends
By: Isha Das
Understanding the 200-Day Moving Average
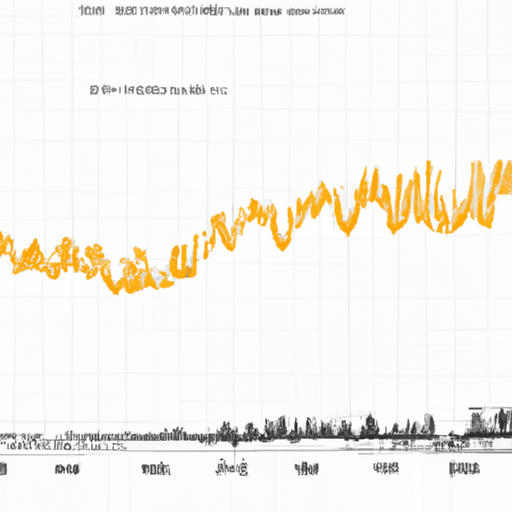
The 200-Day Simple Moving Average (SMA) is a critical technical indicator used in financial analysis to identify and corroborate market trends. It is particularly significant in the cryptocurrency market, where it acts as a key measure of market sentiment and trend direction.
Definition: The 200-Day SMA is calculated by averaging the closing prices of an asset over the past 200 days. This average provides a smoothed line that helps traders and analysts discern the overarching trend of the market, distinguishing between bullish (upward) and bearish (downward) periods.
Impact on Bitcoin
Bitcoin, the leading cryptocurrency, is highly influenced by its movement relative to the 200-Day SMA. As of July 4, Bitcoin's price fell below this critical threshold, positioned at $58,373. This event marks an important transition, often signifying a shift to a bearish market trend.

The movement below the 200-Day SMA acts as a psychological barrier for investors, triggering caution and often resulting in sell-offs. Historically, breaches of this average have been strong indicators of either downward corrections or consolidations in price.
Prior instances, such as in August 2023, showed that a decline below this average led to significant market corrections. The pattern from 2014 to 2024 reinforces the 200-Day SMA's role as a harbinger of market shifts.
Market Repercussions
The current decline below the 200-Day SMA raises concerns about the sustainability of Bitcoin's recent rally, which saw prices peak above $70,000 earlier this year. With the market now navigating post-halving dynamics, this breach suggests potential short-term bearish movements.

For investors and traders, the 200-Day SMA serves as a crucial tool in strategic positioning. Consistent trading below this average typically denotes a downtrend, urging stakeholders to remain vigilant and possibly adopt defensive investment strategies.
As the market continues to evolve, understanding and monitoring the 200-Day SMA can provide valuable insights into the broader market trajectory and help manage investment risks effectively.