Understanding Bitcoin's Price Volatility and Technical Analysis
By: Isha Das
Bitcoin, the world’s leading cryptocurrency, is renowned for its volatile price movements, which can both exhilarate and daunt investors. The recent discussions surrounding Bitcoin’s potential to reach $110,000 exemplify this volatility. Bitcoin’s price movements are often the result of technical factors, market sentiment, and macroeconomic conditions.
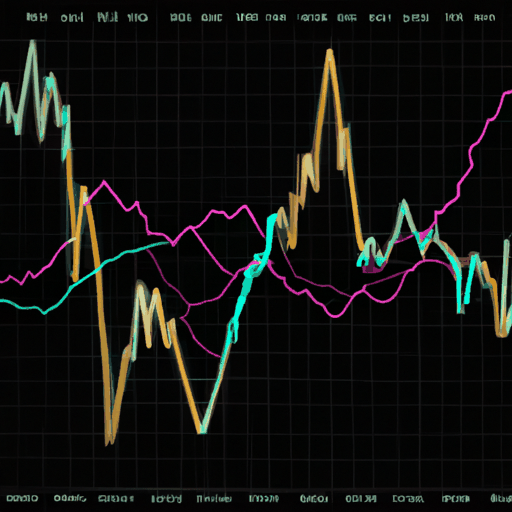
The concept of technical analysis is crucial in understanding these price swings. Technical analysts assess historical price data and trading volumes to predict future price movements. Recent patterns observed include Bitcoin's price hitting highs over $103,600, followed by swift corrections. Analysts have identified specific support levels, such as $96,870, which act as a 'floor' preventing dramatic price declines.
Support and resistance levels are critical concepts in technical analysis. A support level is a price point where a downtrend can be expected to pause due to a concentration of demand. Conversely, a resistance level is where a price rally may halt, as a surge in supply overpowers demand. These levels help traders make buy or sell decisions when the price is close to these points.
Another important aspect is price patterns. The comparison to the 2017 bull run shows that historical volatility can offer insights into possible future trends. Patterns like these can indicate periods of stagnation or potential breakouts, guiding traders in their strategy formulation.
To conclude, understanding Bitcoin's price volatility requires a grasp of technical analysis, including the study of support and resistance levels, as well as historical price patterns. With these tools, traders attempt to forecast price movements and capitalize on Bitcoin's rapid price fluctuations.
Learn more about Bitcoin's price journey.


