Understanding Bull Flag Patterns and Their Implications in Crypto Markets
By: Eva Baxter
Understanding Bull Flag Patterns in Cryptocurrency Trading
In the realm of cryptocurrency trading, technical analysis plays an integral role in helping traders and investors make informed decisions. One of the popular chart patterns traders often rely on is the "Bull Flag" pattern. Understanding this pattern can provide insights into potential future market movements, offering traders an edge in volatile crypto markets.
What is a Bull Flag Pattern?
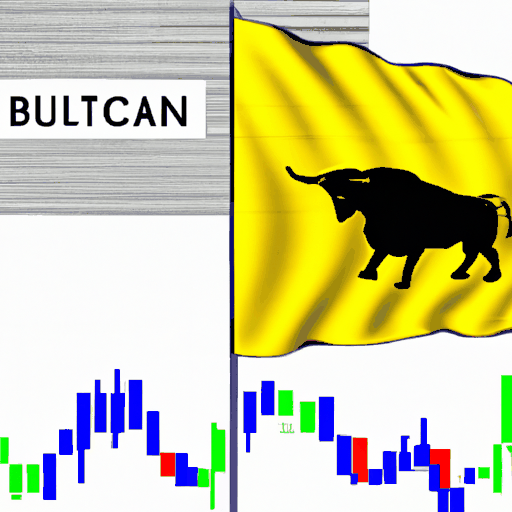
A Bull Flag pattern is a continuation chart pattern that forms during an uptrend, indicating that the previous trend will likely continue. The pattern is named because of its resemblance to a flag on a pole; the "flagpole" represents a sharp price increase leading into a consolidation phase that forms the "flag." The consolidation usually takes the form of parallel price movements or a minor downward slant.
Key Features
- Flagpole: Initiated by a sharp increase in price, the flagpole indicates strong buying pressure and momentum.
- Flag: A consolidation phase where the price moves sideways or slightly downwards within parallel trend lines. This reflects a period of indecision among market participants before the market's next significant move.
- Breakout: The breakout from the parallel trend lines signals the continuation of the upward trend with renewed buying strength.
Why Bull Flag Patterns Matter
Understanding Bull Flag patterns is crucial for traders looking to enter a market opportunity or for those strategically timing their exits. Spotting this pattern could potentially lead to identifying profitable entry points just before a market resumes its upward momentum. It is a signal for traders to anticipate substantial price increases and adjust their strategies accordingly.
Example in Crypto Market: Dogecoin
Recently, analysts observed a Bull Flag pattern forming in Dogecoin's price charts, suggesting a potential upward rally towards targets as high as $2.15. This forecast highlights how such chart patterns can influence market predictions and guide traders in strategizing their positions.
Knowledge of chart patterns like the Bull Flag can be incredibly beneficial in the dynamic and often unpredictable world of cryptocurrencies, allowing traders to capitalize on market trends intelligently. For an in-depth look at current market examples, read the full Dogecoin analysis.


