Understanding Technical Indicators in Cryptocurrency Trading
By: Eva Baxter
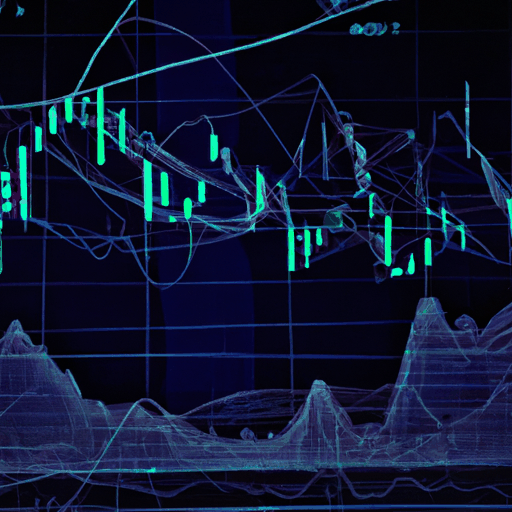
As discussed in recent analyses of Solana's price movements, technical indicators play a crucial role in predicting market behavior and assisting traders in making informed decisions. These indicators are mathematical calculations based on past price, volume, or open interest, helping to gauge future price activity. Two primary indicators mentioned in recent reviews are Moving Averages and MACD (Moving Average Convergence Divergence), each providing insights into momentum and trends.
Moving Averages are utilized to smooth out price data and form the foundation for many technical trading strategies. By comparing current price levels with historical averages, traders can assess market sentiment and potential reversals. A moving average can be simple or exponential, with the latter giving more weight to recent prices for a more responsive indicator.
MACD is another popular tool that indicates changes in the strength, direction, and momentum of a price trend. It is composed mainly of two moving averages - the MACD line and the signal line. When the MACD line crosses above the signal line, it generates a bullish signal, while a cross below suggests a bearish trend. This oscillator can provide both trend-following and momentum signals.
Moreover, the article highlights indicators like the Chaikin Money Flow (CMF), which helps evaluate the buying and selling pressure, and the Relative Strength Index (RSI), used to analyze overbought or oversold conditions. These indicators offer traders a comprehensive view of market dynamics, helping to decide optimal entry and exit points. Understanding these tools is imperative for advanced crypto users seeking to refine their trading strategies and capitalize on market opportunities.
Explore more on Solana's technical analysis here.


