Understanding the Symmetrical Triangle Pattern in Crypto Trading
By: Eva Baxter
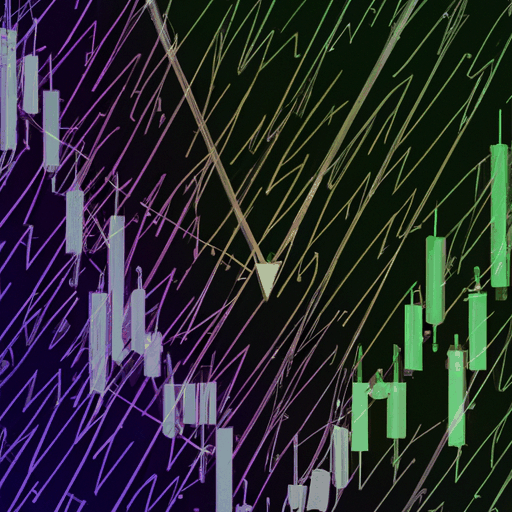
The Symmetrical Triangle pattern is a critical technical analysis tool used by traders to predict potential explosive movements in the cryptocurrency market. It manifests when two converging trendlines join at a point, with prices oscillating between the two lines as they get closer. This pattern symbolizes a period of uncertainty in the market, where the bulls and bears are at equilibrium.
Given the symmetrical nature of the triangle, this figure doesn't inherently indicate whether a breakout will be upwards or downwards. Instead, it serves as a precursor to significant price movement following the breakout, pivotal to the trading strategies for assets like XRP, as seen in recent analyses.
When analysts spot a Symmetrical Triangle, the general practice is to anticipate a breakout once the price moves substantially below or above the triangle lines, which can signal traders about impending market shifts. Typically, this breakout occurs towards the end of the triangle, but the pattern doesn't suggest the breakout direction due to its symmetrical shape.
The strength of a Symmetrical Triangle pattern is that it helps traders across markets, including cryptocurrency, pinpoint opportunities in conditions that may otherwise seem stagnant or non-aggressive. This knowledge aids in building strategic positions to capitalize on future price fluctuations, hence its popular usage among professional traders in the crypto industry.